Box Turtle Bulletin
 News and commentary about the anti-gay lobby
“Now you must raise your children up in a world where that union of man and box turtle is on the same legal footing as man and wife…”
News and commentary about the anti-gay lobbyJune 5th, 2013

The Gallup organization released a poll on Monday revealing that for the first time, more than half of Americans aged 55 and over now see gay relationships as morally acceptable. From 2012 to 2013, support in that age group jumped from 46% to 51%. In that same period, support among those aged 18 to 34 leaped from 65% to 74%, providing further evidence that gay people are simply a non-issue among the younger generations.
Puzzling, though, is that middle group, those aged between 35-54. Their support peaked in 2010 at 59%, and it has drifted downward to the mid-fifties since then. Gallup doesn’t give individual margins of error for each of the groups, and they don’t say what the sample sizes are. They just give an overall samples size of 1,535 for a margin of error of ±3 percentage points. Margins of error for each of the individual groupings would be higher (perhaps as high as the ±5 range), which may mean that the 35-54 group has remained essentially unchanged over the last four years.
Similarly, it’s also conceivable that the jump in support in the older group could be a statistical fluke. I wouldn’t be alarmed if next year’s showing fell a point or two. Even so, the data continues display a very consistent trend over the past ten years.
Latest Posts
Featured Reports
 In this original BTB Investigation, we unveil the tragic story of Kirk Murphy, a four-year-old boy who was treated for “cross-gender disturbance” in 1970 by a young grad student by the name of George Rekers. This story is a stark reminder that there are severe and damaging consequences when therapists try to ensure that boys will be boys.
When we first reported on three American anti-gay activists traveling to Kampala for a three-day conference, we had no idea that it would be the first report of a long string of events leading to a proposal to institute the death penalty for LGBT people. But that is exactly what happened. In this report, we review our collection of more than 500 posts to tell the story of one nation’s embrace of hatred toward gay people. This report will be updated continuously as events continue to unfold. Check here for the latest updates.
In 2005, the Southern Poverty Law Center wrote that “[Paul] Cameron’s ‘science’ echoes Nazi Germany.” What the SPLC didn”t know was Cameron doesn’t just “echo” Nazi Germany. He quoted extensively from one of the Final Solution’s architects. This puts his fascination with quarantines, mandatory tattoos, and extermination being a “plausible idea” in a whole new and deeply disturbing light.
On February 10, I attended an all-day “Love Won Out” ex-gay conference in Phoenix, put on by Focus on the Family and Exodus International. In this series of reports, I talk about what I learned there: the people who go to these conferences, the things that they hear, and what this all means for them, their families and for the rest of us.
Prologue: Why I Went To “Love Won Out”
Part 1: What’s Love Got To Do With It?
Part 2: Parents Struggle With “No Exceptions”
Part 3: A Whole New Dialect
Part 4: It Depends On How The Meaning of the Word "Change" Changes
Part 5: A Candid Explanation For "Change"
 At last, the truth can now be told.
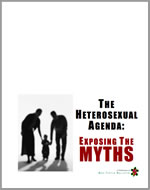
Using the same research methods employed by most anti-gay political pressure groups, we examine the statistics and the case studies that dispel many of the myths about heterosexuality. Download your copy today!
And don‘t miss our companion report, How To Write An Anti-Gay Tract In Fifteen Easy Steps.
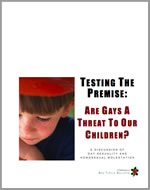 Anti-gay activists often charge that gay men and women pose a threat to children. In this report, we explore the supposed connection between homosexuality and child sexual abuse, the conclusions reached by the most knowledgeable professionals in the field, and how anti-gay activists continue to ignore their findings. This has tremendous consequences, not just for gay men and women, but more importantly for the safety of all our children.
Anti-gay activists often cite the “Dutch Study” to claim that gay unions last only about 1½ years and that the these men have an average of eight additional partners per year outside of their steady relationship. In this report, we will take you step by step into the study to see whether the claims are true.
Tony Perkins’ Family Research Council submitted an Amicus Brief to the Maryland Court of Appeals as that court prepared to consider the issue of gay marriage. We examine just one small section of that brief to reveal the junk science and fraudulent claims of the Family “Research” Council.
 The FBI’s annual Hate Crime Statistics aren’t as complete as they ought to be, and their report for 2004 was no exception. In fact, their most recent report has quite a few glaring holes. Holes big enough for Daniel Fetty to fall through.
“Google” is a trademark of Google Inc.
© Box Turtle Bulletin. All Rights Reserved.

Hyhybt
June 5th, 2013
I don’t trust their data for 2014.
Robert
June 5th, 2013
It is also possible that support in that group changed as their children and grandchildren were able to marry each other. The change in the number of States in which we now have equality makes a difference to people. The more they see that it doesn’t mean the “end of the world” the more their numbers will change. Not to ention that year by year individuals from the lower age catagories move up into that group while the older ones who are more rigid just die off. But I am glad to see these numbers, and would be interested in seeing the changes in the future.
Sandhorse
June 5th, 2013
‘If’, has been left in the ash heap of history. ‘When’, is where our sights are now set.
Jim Burroway
June 5th, 2013
Robert, you raise a good point on what might explan part of the change:
The change in the number of States in which we now have equality makes a difference to people. The more they see that it doesn’t mean the “end of the world†the more their numbers will change.
It would be fascinating to see if there’s enough information in a poll like this to look at the numbers of those 55 and older in states with full marriage equality for 2-3 years or more and compare that to those in states without marriage equality. (Civil unions, domestic partnerships, etc. might be too muddy to get a good look at the dynamic. I wonder how many non-gay people in Nevada know that partners can register in Nevada?)
Timothy Kincaid
June 5th, 2013
Another human trend that might perhaps have some influence on the odd change is that generations tend to alternate on issues. Children and grandparents often will agree while parents differ.
There may be a group in their mid 30s that are not supportive that just slid from young to middle. Sort of a rounded M shape that while the total population is rising in the poll, the slide of the M just triggered a huge increase in young by moving out of that bracket and put a drag on the middle bracket. At the other end of the M, their parents may just be entering the older bracket.
Not sure I explained that well, but it could be a factor if, as is often the case, the generational shift is present on this issue. Or maybe not.
Mark W
June 5th, 2013
Someone already alluded to this, but since the article hasn’t changed I will point out that “From 2013 to 2014, support in that age group jumped from 46% to 51%.” Should read “From 2012 to 2013….” Time is going by fast enough as it is. Please don’t make it go by faster! :)
Jim Burroway
June 5th, 2013
When I wrote it, I had it as “from 2011 to 2012″. When I reread it before posting, I saw it and said to myself, ” That’s not right!” And so I fixed it.
I’ve fixed it again.
jpeckjr
June 5th, 2013
I am going to challenge an aspect of the poll — the age cohorts. The youngest one spans 16 years. The middle one spans 19 years. The older spans 50 years (or whatever the difference is between 55 and the oldest person surveyed.) That older cohort includes late baby boomers like me (age 55) and my 92-year old mother. Although she loves me and has accepted she has a gay son, she’d probably say “morally unacceptable” to a pollster.
Could the shift in the older cohort be explained partly by the age range it covers? That is, are the younger members of the older cohort more accepting than the older members of the older cohort? If there were four cohorts, 55 – 69 and 70 and above (spans more in keeping with the other two), I wonder what the results would be?
Gerald
June 6th, 2013
I don’t have any science to back up my hunch, but it really doesn’t surprise me that older people would become more accepting as they age. While certainly not universal, many seniors have seen and heard all the arguments and may have adopted a more “live and let live” approach as they come to know their children, grandchildren, or nieces and nephews who are out. My parents were very reactionary about social issues in their 40s, but 25 years later they had mellowed considerably. I found that this phenomena isn’t all that unusual with older folks nowadays, including my elderly neighbors who are just as sweet and accepting of my partner and I as they can be. Maybe they believe otherwise behind our backs, but that would surprise me based on their actions.
Charles
June 6th, 2013
It certainly has gotten better in my lifetime. I was born in 1951. I went through hell. I just hope that it continues to get better for the sake of the coming generations.
Richard Rush
June 6th, 2013
jpeckjr, you raise a good point, and I may be sensitive to it because I’m 68. The fact that the oldest cohort is 55-and-up may be a result of ageist bias by the pollsters. The underlying mindset may be: “What’s the difference if one person is 56 and another is 96, they’re both old.”
jpeckjr
June 6th, 2013
@Richard Rush. A couple of years ago, I was honored to receive an award from a local student LGBT group. For lifetime achievement in advocacy for LGBT equality. The description of the award said it was for a “senior citizen.” I was 53. I had a little talk with the award sponsors about age perceptions.
jpeckjr
June 6th, 2013
@Richard Rush. The difference between a 56 year old and a 96 year old may be that were raised in different times, when homosexuality was treated differently in law and culture, and might, therefore, have different opinions. A 96 year old was a teenager in the 1930s, when homosexuality dare not spoke its name. A 56 year old was a teenager in the 1970s, after Stonewall, when homosexuality was daring to speak publicly. Very different times for forming opinions. Very different experiences in living in a diverse society.
Robert
June 6th, 2013
jpeckjr and Richard Rush,
It is possible, and I think almost 100% probable that the last age group is what it is because when the groups were first formed as representative age grops, people in the later group did not live as long as they do today. 70 years ago you wouldn’t have too many people above late 70’s early 80’s. Not nearly as much as you see today. As we live longer lives they may indeed need to change that last age group by adding one more.
Also, it was generally an advertising or sales demographic that is being referenced in these age groups and most people over a certain age have made up their minds and are more “brand” loyal than those below them, the idea being that once you reach a certain age your views on matters are pretty settled and would rarely change.
But I think lifespan is the key to the final current age group. In 1940 men lived to be an average of 53.9 years old, in 1990 it was 72.3, and it keeps growwing as the years go by. (Source is Social Security website on age expectancy)
http://www.ssa.gov/history/lifeexpect.html
Priya Lynn
June 6th, 2013
It would be informative to see a rolling poll with people grouped by the year they were born rather than their age. This would show whether people’s attitudes are changing as they age or they’re just being replaced by more liberal younger people.
Palmer
June 6th, 2013
Gerald, that was my experience with my parents. When I was a teenager they were fairly conservative (though liberal by Utah standards, but then again we weren’t Mormons).
But once I met my husband and we lived together for longer than all three of my sister’s marriages, my younger brother’s first marriage and my eldest brother’s first two marriages, they saw that perhaps it was better to unbend and become more accepting not just of me, but also one of my nieces. Funny how have a gay family member or two will do that to people.
Hyhybt
June 6th, 2013
I suspect one reason for the extra-long age group at the top is that a lot of people simply don’t *make* it to their 80s and 90s, and many of those who do aren’t particularly active anymore.
Alternately, perhaps they started by setting the middle group and then comparing it to “everyone older” and “everyone younger.” Younger, of course, has a hard limit; older doesn’t in any world I’d care to live in.
jpeckjr
June 6th, 2013
@Robert. The chart goes back only to 2001. That’s 12 years, not 70, and there is no indication this question was being asked by Gallup in 1943. In addition, the age cohorts are determined by the pollster. Gallup could break out the data in five-year cohorts, if they asked birth year (as Priya Lynn suggests) rather than age. It may very well be that in 2001, or whenever Gallup first asked this question, they used these age cohorts.
It still seems to me that breaking the oldest cohort into two would give a better picture of attitudes, even for marketing and advertising purposes. If the 55 – 69 cohort is 58% favorable, while the 70 and above cohort is 44% favorable (arbitrary numbers for example only), that could impact a marketing strategy.
And, as I noted above, including 55 year old me in the same cohort as my 92 year old mother makes no demographic sense.
jpeckjr
June 6th, 2013
Follow-up to last post: the Gallup page says this poll has been conducted since 2001. Go to the link and see the entire list of behavior they are polling on with regard to moral acceptability.
markanthony
June 7th, 2013
I think Timothy’s suggestion makes alot of sense. It not only explains the decline in the middle age group but also the 6 point jump among 18-34 group in the 2011 survey.
Jim doesn’t really dewell on the 9 point increase among the young group in 2012. What would have cause that? The Election?
Lymis
June 8th, 2013
It’s also worth noting that not all of the same people who were “35-54” in 2004 are still in that age cohort nearly 10 years later.
Even if not a single person changed their view, since the youngest people in the 2004 study were vastly more gay-positive, as they age, the age cohorts will reflect that changing view.
This sort of model presupposes that there is something inherent about being 40 that makes one think differently about equality than one does at 20 – a view that might be true in matters like banking, home ownership and whether or not teenagers should have sex (it’s different when it’s your daughter getting laid than when it’s you).
But I’ve never seen a particularly compelling model that explains why anyone who comes to the conclusion that gay people are equal citizens should change that later in life.
I’d like to see this same data presented in cohorts based on birth year rather than on current age. Then we can see whether people are getting more tolerant, or if i’s just that people age.
Priya Lynn
June 8th, 2013
I’m with you Lymis, I don’t think anyone who supports marriage equality decides to oppose it just because they got older.
Leave A Comment