Box Turtle Bulletin
 News and commentary about the anti-gay lobby
 News and commentary about the anti-gay lobby
November 27th, 2009
The FBI has issued its annual Hate Crimes Statistics for 2008, and there’s a lot of talk about how much the statistics for hate crimes based on sexual orientation went up. But before we jump on that bandwagon, Andrew Sullivan points us to an important caution by Mark Thompson who sees what he considers an “annual misuse of hate crime statistics“:
Every year around this time, the FBI publishes its statutorily-mandated annual report on hate crime statistics. Like clockwork, every year that report gets misused no matter what the FBI does to discourage that misuse (previous examples of misuse here). This year is no exception, as several prominent liberal sites have picked up on the lede that this year\’s report shows a “sharp increase” in anti-gay hate crime while also noting that race-based hate crimes barely decreased at all.
The problem is that these particular FBI statistics are virtually useless for evaluating year-to-year trends – always have been, always will be. This year, the FBI itself went out of its way to warn against such readings, stating “our Uniform Crime Reporting (UCR) Program doesn\’t report trends in hate crime stats—yearly increases or decreases often occur because the number of agencies who report to us varies from year to year.”
Reporting hate crimes to the FBI is voluntary. Local law enforcement agencies aren’t required to participate in the FBI’s hate crime statistics gathering program, nor do they receive any federal funds when they do so. This means that year t0 year, different segments of the total U.S. population are represented in the hate crime statistics depending on whether the local law enforcement agency chooses to participate.
In 2003, 11,909 law enforcement agencies covering 82.3% of the population participated in the program. In 2008, that number reached a record high of 13,690 agencies covering 88.6% of the population. By the way, that’s up from 13,241 last year, in which 86.3% of the population was covered. Meanwhile, the U.S. added an estimated 2.4 million people to the overall population according the the U.S. Census Bureau.
All of that together is a complicated way of noting that the population covered by the 2008 hate crimes statistics is 3.4% larger than that covered by the 2007 statistics. This means that even if hate crimes went up 3.4% over last year, it means that the rate of hate crimes is effectively unchanged.
So having said all that, let’s look at the hate crimes statistics themselves. The FBI collects three sets of hate crime statistics: hate crime incidents, offenses, and victims. According to the FBI’s definition, an incident represents a single occurrence of one or more hate crime offenses (each offense being an assault, a robbery, an act of vandalism, etc.) against one or more victims. The statistics for 2008 look like this (2007 data in parentheses):
| Total Hate Crime Incidents, 2008 (2007) |
Total Hate Crime Offenses, 2008 (2007) |
Total Hate Crime Victims, 2008 (2007) |
|
|---|---|---|---|
| Race | 3,992 (3,870) |
4,704 (4,724) |
4,934 (4,965) |
| Religion | 1,519 (1,400) |
1,606 (1,477) |
1,732 91,628) |
| Sexual Orientation | 1,297 (1,265) |
1,617 (1,460) |
1,706 (1,512) |
| Ethnicity | 894 (1,007) |
1,148 (1,256) |
1,226 (1,347) |
| Disability | 78 (79) |
85 (82) |
86 (84) |
| TOTAL | 7,783 (7,624) |
9,168 (9,006) |
9,691 (9,535) |
| Totals don’t add up due to additional multi-category hate crime incidents, offenses and victims. |
|||
From a raw numerical standpoint, hate crimes went up broadly in most categories (race, religion, sexual orientation, etc.) and by most measures (incidents, offenses and victims). So now it’s time to factor in the growth of reporting agencies as well as the growth of the overall U.S. population. And to try to discern longer-term trends, let’s go back to 2000 and see what it all looks like. The following graphs show what the hate crimes data looks like over the past decade as a proportion to the size of the population covered in those respective years.


 The most notable trend can be seen in reported hate crimes based on race., which have been decreasing dropping through most of the decade. Also notable is the slow but inconsistently lowering of hate crimes based on ethnicity following a huge spike in 2001, caused by a large surge in crimes against people of Middle Eastern backgrounds following 9/11. (Anti-Islamic sentiment also contributed to a spike in religious-based hate crimes the same year.)
But for hate crimes based on sexual orientation, the message appears mixed. One might be tempted to conclude that there has been a slight overall rise in hate crimes based on sexual orientation over the past three years. But given the many issues which contribute to inaccuracies in reporting of hate crimes based on sexual orientation, it is virtually impossible to categorically announce such a trend, as many other web sites have done. The kind of changes that we’re seeing year-to-year amount to statistical noise are clouded by many factors including:
And with this years’ passage of the Matthew Shepard Hate Crimes Act, observable trends over the next several years will be massively complicated as aspects of the law dealing with local assistance and reporting go into effect. With all these factors in play, it would take a considerable swing to be able to discern a real trend in hate crimes based on sexual orientation. That large swing isn’t there, and any attempt to divine a trend based on sexual orientation is unjustified. Mark Thompson is right. There just isn’t quite enough there there.
But there is one disturbing trend that you can legitimately draw from the latest hate crime statistics: hate crimes based on sexual orientation are noticeably more violent than crimes motivated by other biases.
Latest Posts
Featured Reports
 In this original BTB Investigation, we unveil the tragic story of Kirk Murphy, a four-year-old boy who was treated for “cross-gender disturbance” in 1970 by a young grad student by the name of George Rekers. This story is a stark reminder that there are severe and damaging consequences when therapists try to ensure that boys will be boys.
When we first reported on three American anti-gay activists traveling to Kampala for a three-day conference, we had no idea that it would be the first report of a long string of events leading to a proposal to institute the death penalty for LGBT people. But that is exactly what happened. In this report, we review our collection of more than 500 posts to tell the story of one nation’s embrace of hatred toward gay people. This report will be updated continuously as events continue to unfold. Check here for the latest updates.
In 2005, the Southern Poverty Law Center wrote that “[Paul] Cameron’s ‘science’ echoes Nazi Germany.” What the SPLC didn”t know was Cameron doesn’t just “echo” Nazi Germany. He quoted extensively from one of the Final Solution’s architects. This puts his fascination with quarantines, mandatory tattoos, and extermination being a “plausible idea” in a whole new and deeply disturbing light.
On February 10, I attended an all-day “Love Won Out” ex-gay conference in Phoenix, put on by Focus on the Family and Exodus International. In this series of reports, I talk about what I learned there: the people who go to these conferences, the things that they hear, and what this all means for them, their families and for the rest of us.
Prologue: Why I Went To “Love Won Out”
Part 1: What’s Love Got To Do With It?
Part 2: Parents Struggle With “No Exceptions”
Part 3: A Whole New Dialect
Part 4: It Depends On How The Meaning of the Word "Change" Changes
Part 5: A Candid Explanation For "Change"
 At last, the truth can now be told.
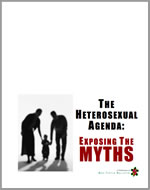
Using the same research methods employed by most anti-gay political pressure groups, we examine the statistics and the case studies that dispel many of the myths about heterosexuality. Download your copy today!
And don‘t miss our companion report, How To Write An Anti-Gay Tract In Fifteen Easy Steps.
 Anti-gay activists often charge that gay men and women pose a threat to children. In this report, we explore the supposed connection between homosexuality and child sexual abuse, the conclusions reached by the most knowledgeable professionals in the field, and how anti-gay activists continue to ignore their findings. This has tremendous consequences, not just for gay men and women, but more importantly for the safety of all our children.
Anti-gay activists often cite the “Dutch Study” to claim that gay unions last only about 1½ years and that the these men have an average of eight additional partners per year outside of their steady relationship. In this report, we will take you step by step into the study to see whether the claims are true.
Tony Perkins’ Family Research Council submitted an Amicus Brief to the Maryland Court of Appeals as that court prepared to consider the issue of gay marriage. We examine just one small section of that brief to reveal the junk science and fraudulent claims of the Family “Research” Council.
 The FBI’s annual Hate Crime Statistics aren’t as complete as they ought to be, and their report for 2004 was no exception. In fact, their most recent report has quite a few glaring holes. Holes big enough for Daniel Fetty to fall through.
There are no comments for this post.
Leave A Comment